PlaceSpeak Analytics Project with BCIT

Share
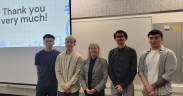
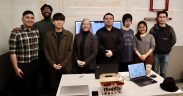
In April 2025, PlaceSpeak worked with five BCIT students in the Computer Systems Technology program as part of the Industry Sponsored Student Projects program (ISSP).
The Industry Sponsored Student Projects program (ISSP) provides students with real-life experience by working on IT or software development projects directly from industry. Students work in teams or individually with an industry sponsor, proceeding through the development life-cycle to develop IT or software solutions. The concept of ISSP is simple: put BCIT Computing students to work on creating a viable software solution for your business challenge.

The BCIT students presented their Industry Sponsored Student Project (ISSP) on May 21st at BCIT. The team consisting of Alex Park, Martin Siu, Maddelin Maddelin, Brian Lee, and Corey McTavish took on a project for PlaceSpeak to develop an analytics system powered by OpenAI to process and visualize user feedback data.
Here is a link to the final presentation slides: BCIT ISSP Final Presentation
The objective was to develop a Flask backend that leverages the OpenAI API to analyze user feedback and generate AI-powered reports with interactive charts and visualizations. The system efficiently processes large datasets, while a responsive UI presents insights with the option to download reports as PDFs. The primary goal was to ensure the generated reports are accurate, reliable, and insightful.


The solution successfully generates various visualizations from consultation data including:
- Area Distribution: A horizontal bar graph that visually compares the number of comments across different areas, useful for quickly identifying which locations have the most and least comments.
- Sentiment by Area: A graph showing the average sentiment (positive or negative feeling) for different locations, with green bars indicating positive sentiment and red indicating negative.
- Sentiment Distribution: A pie chart showing how sentiment is divided into three categories: negative, neutral, and positive, offering a quick understanding of the overall distribution of sentiment.
- Top Keywords / Word Cloud: Visual representations showing word frequency in text, with bigger words indicating more frequent usage, giving a quick sense of the main topics in discussions.
- Top Phrases: Analysis finding common N-grams (like Bigrams – two-word phrases), providing clearer meaning and context than single words.
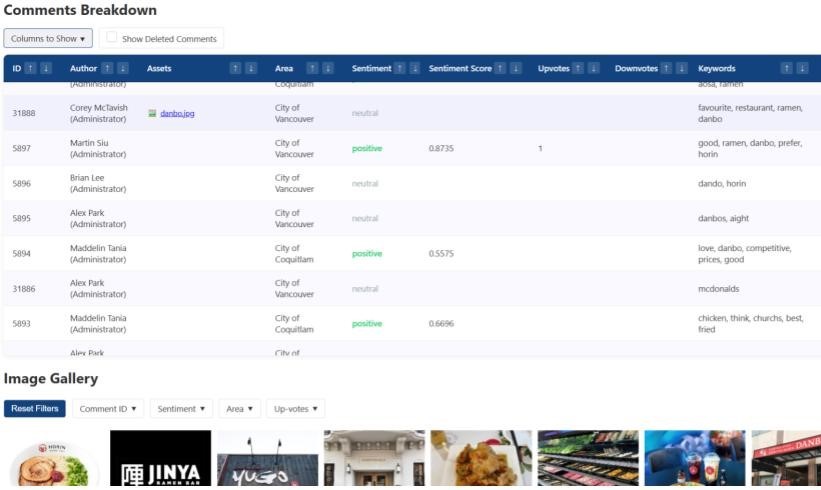
- Comment Tag Breakdown Table: Breaking down comments by sentiment, topic, and engagement, including media submitted with comments to help identify key issues and trends.
- Asset Summary: Showing number of submitted images/videos by category, organized by sentiment or area of concern to highlight patterns in public visual engagement.
- Image Gallery: An interactive gallery of participant-submitted images with filtering capabilities by area, sentiment, popularity, or comment ID.
The team utilized a modern technology stack including HTML, CSS, JavaScript, OpenAI, ChartJs, jsPDF, SQLite, Python, Flask, and SQLAlchemy to build this solution.